Introduction
Virtually every asset that an Infrastructure Utility Provider (provider) utilises to provide a service will deteriorate and eventually need replacing.
The decision to replace or not will be driven by some combination of the level of service obligations, risk management, technology, legislation, economic and/or strategic considerations. The new asset might provide more capacity and enhanced functionality, but a primary driver will typically be the continuation of the current service.
The cost of replacing assets imposes a significant financial burden on the provider that must be recovered from current and future customers through tariffs, connection fees, depreciation charges, debt (and associated debt servicing) and retained earnings. Therefore, the provider must understand what the renewed asset will look like, when the renewal will be required, what it will cost, the challenge that this work will impose on the organisation, and the likely impact on customer charges and profitability. Key outcomes from this thinking is an appreciation of the extent to which the future will be different from ‘Business as Usual’ today and a ‘no surprises’ foundation for future planning.
For Local Government providers of water services and roading, there is a legislated requirement to look at least 30 years into the future and predict the extent of works required for renewals, growth, level of service change and resilience. This information is presented in the Infrastructure Strategy, and the funding and cost implications should be presented in the associated Financial Strategy.
This discussion is intended to be consistent with the discussion and guidance presented in the International Infrastructure Management Manual (IIMM).
Overall Approach – The 4 Quadrant Approach
ProjectMax promotes using a 4 Quadrant Approach to explore the different types of renewal planning that need to be undertaken. This approach recognises that renewal planning is not ‘one size fits all’ and that quite different approaches should be utilised for the different aspects being considered. It is still important to maintain an overview and a consistent set of assumptions, but we believe this can be accommodated more easily using the 4 quadrants than applying a single process across all renewal planning.
This discussion utilises water services pipes in a Local Government context to provide examples of the approach. However, the logic can also be applied to plant and equipment and other utility services such as roading, rail, power, telecoms, etc. The logic can also be applied to buildings, plants and equipment, across many sectors.
The 4 Quadrant Approach is illustrated in the following diagram:
Critical Assets
Short Term Planning (LTP)
Routine renewal of customer service pipes and collection systems
“Just in time’ renewal of critical pipes
Long Term Planning (Infrastructure Strategy)
Predicting future renewals of collection and distribution systems
Predicting future renewal of critical pipes
The 4 quadrants are split across Non-critical and Critical pipes and Short and Long term planning.
Provision also needs to be included for pipes of intermediate criticality and planning for intermediate time periods, e.g. 5-20 years. These intermediate portions (illustrated in gold above) are necessarily a blend of the main drivers that emerge from exploring the 4 main quadrants and overlaying them across the intermediate zones
The short term planning can be characterised as ‘Bottom-Up’ (evidence-based) while the long term planning can be characterised as ‘Top-Down’ (trend analysis).
The overall process encompasses 4 distinct steps :
- Explore each of the 4 quadrants to determine what each reveals in relation to renewal predictions for the short and long term
- Explore the sensitivity of the predictions to changes in assumptions and the effect of smoothing
- Identify any differences that emerge that seem to be significant and provide explanations, or identify further investigations that might provide better alignment in the future
- Adopt outcomes that can be implemented in the short term and which provide an acceptable basis for planning for the longer term.
The Importance of Criticality
A key element in the discussion is the separation of Critical Assets from Non-Critical assets.
This is driven by the realisation that most networks will have a relatively small number of assets whose consequences of failure are significantly worse than the rest of the network, and therefore much less acceptable to the provider, the regulator and/or customers. These consequences might be measured in terms of health, injury, damage to the environment, damage to property, impact on business and employment, disruption of other utilities, etc.
Within this context, it is accepted that all asset failures invariably have some consequences. However, at the non-critical end of the spectrum, these are considered to be acceptable within the definition of ‘business as usual’ and managed by the usual Call-Centre contact, repair crew response and routine reporting and planning processes. A ‘fix when fail’ approach is acceptable for these non-critical assets.
By comparison, assets with elevated levels of criticality should be managed with a quite different approach as, virtually by definition, these are asset failures that the provider wishes to avoid altogether, or at least try to manage to an acceptable level.
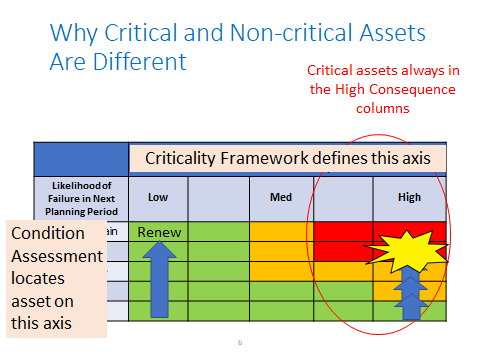
The following graphic illustrates how critical and non-critical assets occupy quite different positions on the typical Risk Matrix.
Dealing With Uncertainty
Something that will almost certainly become apparent if you work through this process is the uncertainty evident in many assumptions. We do not have all the information we need to make accurate predictions, and even if we did have more and better, information it might simply confirm that dealing with uncertainty cannot be avoided.
The planning process typically requires you to generate a ‘single, best’ answer that will be included in renewal forecasts that are presented to councils, boards, communities and customers. In doing so, it must be highlighted that uncertainty exists. While the forecast is considered to be the most reasonable at the time, there has been consideration of alternative scenarios to assess the sensitivity of the adopted position and the implications of differences occurring.
This approach requires a conversation between the financial arm of the provider’s organisation and the asset management arm to ensure a consistent understanding of the uncertainty, and associated risks, that are inevitably present. Spreadsheets will happily generate data and graphs from the information and assumptions used, but this does not make it true.